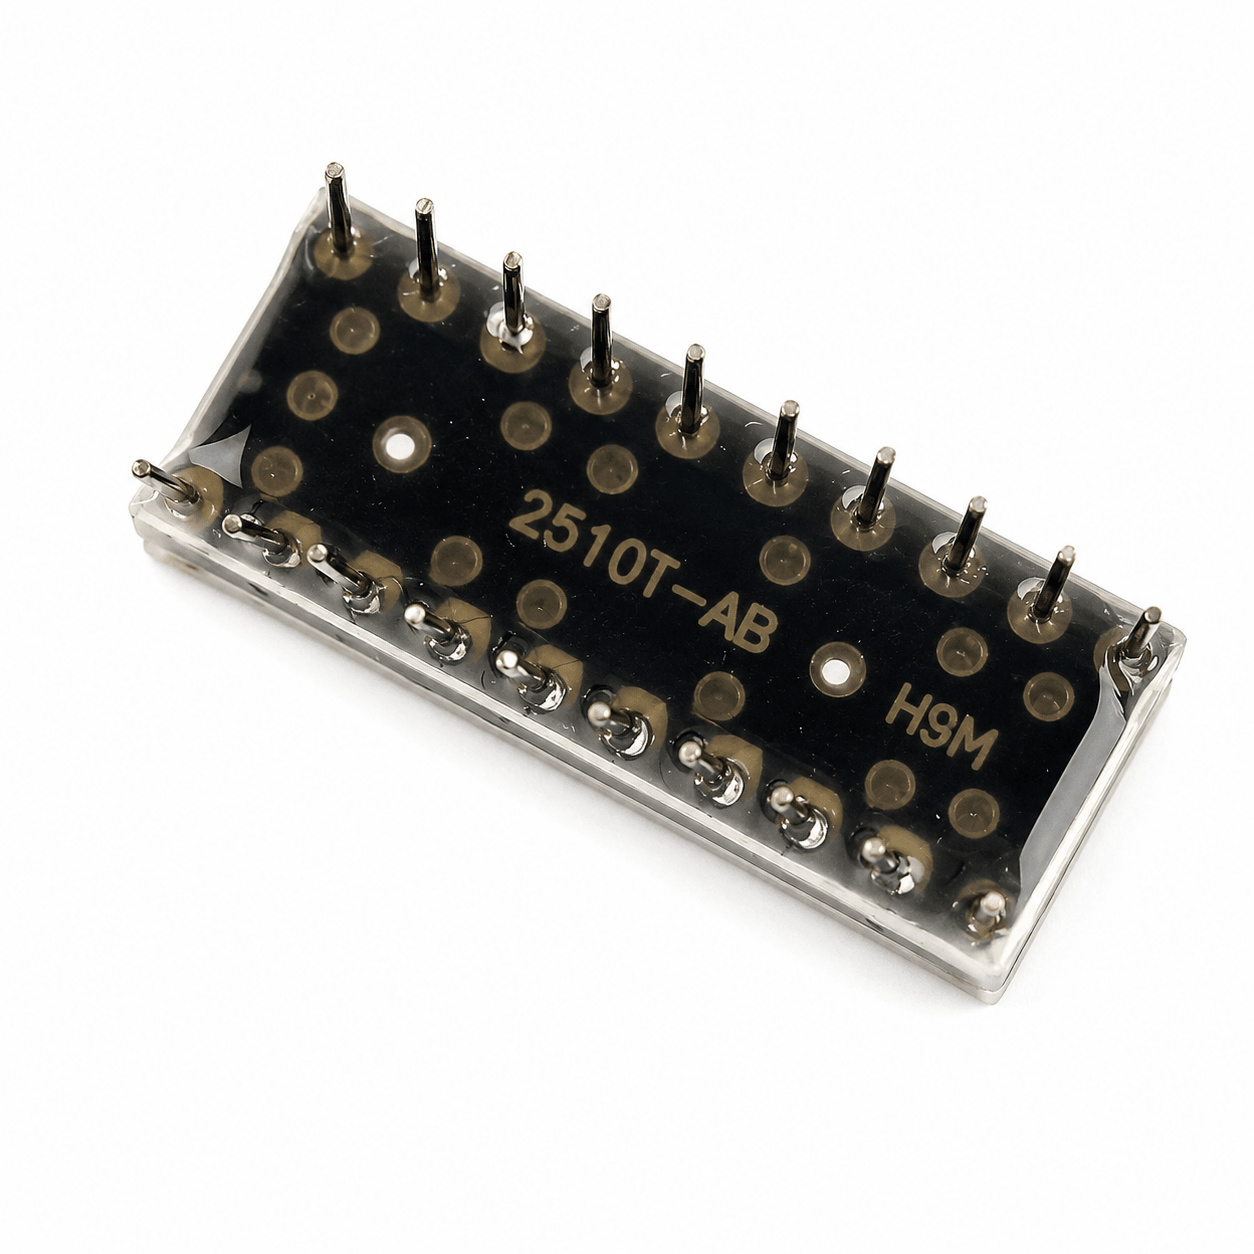
10 Segment LED Bar Graph - Red

SKU: 6LZUXJ4BXV
★★★★
4.5 (140 reviews)
The 10 Segment LED Bar Graph – Red is a compact visual display component consisting of 10 individually controllable red LED segments arranged in a single linear package. It is designed to provide an easy-to-read graphical indication of signal level, battery charge, audio level, temperature, voltage, speed, sensor output, or other measured values. Each LED segment can be controlled independently,...
Regular price Rs. 35.00
Regular price Rs. 39.00 Sale price Rs. 35.00
Save Rs. 4
Sold out
Tax included. Shipping calculated at checkout.
COD Available
Easy Return
Quality Assured
12 people are viewing this right now
For Bulk Order Contact Us View full product details
Same Day Dispatch Order before 2PM
Pan India Delivery Shipping in 24-48H
Secure Packaging Safe & Damage Free
Dedicated Support Expert Assistance

The 10 Segment LED Bar Graph – Red is a compact visual display component consisting of 10 individually controllable red LED segments arranged in a single linear package. It is designed to provide an easy-to-read graphical indication of signal level, battery charge, audio level, temperature, voltage, speed, sensor output, or other measured values.

Each LED segment can be controlled independently, allowing the display to operate in bar mode, where multiple LEDs illuminate progressively, or dot mode, where only one LED indicates the current level. The display can be controlled directly using microcontroller GPIO pins through suitable current-limiting resistors or combined with LED driver ICs for more efficient level-display applications.

The compact through-hole package makes the LED bar graph suitable for breadboard experiments, PCB designs, control panels, electronic instruments, battery indicators, audio VU meters, and educational electronics projects. It can be used with Arduino, ESP32, STM32, Raspberry Pi GPIO, PIC, AVR, 8051, shift registers, and dedicated LED bar graph driver ICs.

Key Features

  • 10 individual red LED segments
  • Linear bar graph display format
  • Each LED segment can be controlled independently
  • Bright red LED illumination
  • Supports bar mode and dot mode applications
  • Fast LED switching response
  • High visibility and clear indication
  • Compact rectangular package
  • Low power consumption
  • Standard through-hole mounting
  • Suitable for breadboard and PCB applications
  • Easy interfacing with microcontrollers
  • Can be controlled using shift registers
  • Compatible with dedicated LED bar graph driver ICs
  • Suitable for level, status, and progress indication
  • Ideal for electronic instruments and control panels

Shipping & Returns

Orders placed before 3 PM IST will be shipped on the same day (excluding Sundays and Public holidays) through our shipping partners. In rare cases, the pickup may get delayed during Public holidays / Bandh / Environmental disturbances.

Specifications

Specifications:

Display Type: LED Bar Graph Display
Display Color: Red
Number of Segments: 10
Number of LEDs: 10 Independent LED Elements
Display Arrangement: Single Linear Row
LED Technology: Red Light-Emitting Diode
Output Color: Red
Typical Forward Voltage per Segment: Approximately 1.8V to 2.2V
Recommended Forward Current per Segment: Approximately 10mA to 20mA
Maximum Forward Current: Model Dependent
Peak Wavelength: Approximately 625nm to 635nm
Luminous Intensity: Model Dependent
Viewing Angle: Typically Wide-Angle
Number of Pins: 20
Pin Arrangement: 2 Pins per LED Segment
Segment Control: Individual LED Control
Polarity: Individual Anode and Cathode Connections
Operating Mode: Bar Mode or Dot Mode, Depending on Driver Circuit
Mounting Type: PCB Through-Hole
Package Type: Rectangular DIP-Style LED Bar Graph
Typical Dimensions: Approximately 25.4mm × 10mm × 7.9mm, Model Dependent
Operating Temperature: Approximately -25°C to +85°C, Model Dependent
Compatibility: Arduino, ESP32, STM32, Raspberry Pi GPIO, PIC, AVR, 8051, LM3914, LM3915, LM3916, shift registers and transistor driver circuits

Additional Resources

FAQ

1. What is the 10 Segment Red LED Bar Graph used for?

The LED bar graph is used to visually display levels and status information such as battery charge, audio level, signal strength, voltage, temperature, sensor readings, and progress indication.

2. Can each LED segment be controlled independently?

Yes. The 10 LED segments can be controlled individually, allowing custom patterns, progressive bar displays, level indicators, and status animations.

3. Can the 10 Segment LED Bar Graph be connected to an Arduino?

Yes. The display can be controlled using Arduino, ESP32, STM32, Raspberry Pi GPIO, PIC, AVR, and other controllers. Suitable current-limiting resistors or a dedicated LED driver circuit should be used.

4. Which driver ICs can be used with the LED Bar Graph?

The display can be used with LED level driver ICs such as LM3914, LM3915, and LM3916. It can also be controlled using shift registers, transistor arrays, or microcontroller GPIO pins.

5. Does the LED Bar Graph support both bar and dot display modes?

The LED package itself contains 10 independent LEDs. Bar or dot operation is determined by the connected control circuit or driver IC, allowing the same display to be used for either type of indication.